Accessed from Reports
The Sales Statistics Evaluation Report collects all customer transaction data for a selected date range. This extracted cube of data can then be viewed in various ways and output as a print or CSV file.
To run the report, first enter the data range for the data capture. Once complete the following screen is shown.
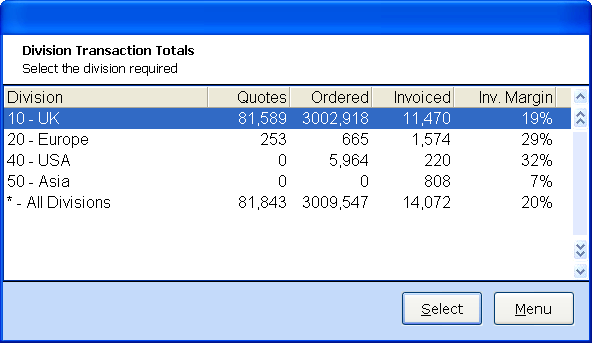
The value of all Quotes, Orders and Invoices for the date range are displayed in total and split by division. (Divisions not available in QXLite)
Highlight either the division or total for selection and full detail.
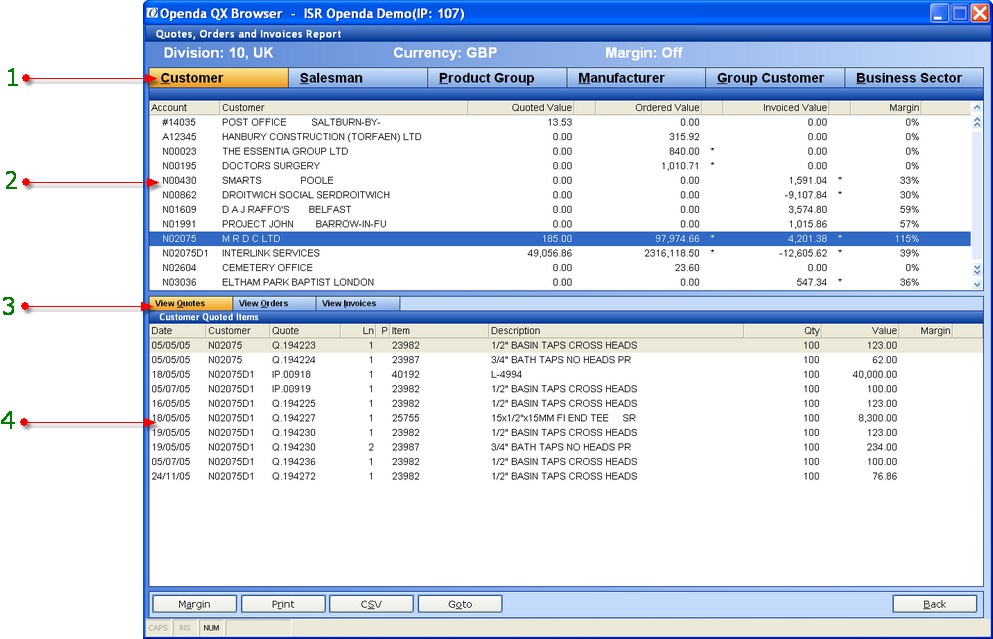
1 - The TAB heading represents the various ways the data can be split.
2 - Top line totals for quotes, orders and invoices along with the average invoice margin, for each Customer, Salesman, Business Sector etc. Dependant on the TAB selected.
3 - The detailed breakdown list for the highlighted line, of the quote, order and invoice figures (dependent on the TAB selected).
4 - Transaction details.
The information can be output to PRINT or CSV at header level or at detail level by activating the lower grid, where further links to ITEM ENQUIRY and transaction VIEW options are available.
The print and csv format will be based on the split type. i.e. customer, product group etc.
The MARGIN option will reduce the list to groups where the margin has fallen below an acceptable level. These records are indicated by a " * ".
The margin level deemed acceptable is set in the Parameter Settings.